Distillation Tutorial VI: Non-Pinched, Minimum Energy Distillation Design (Main Page)
Distillation is a very energy intensive separation process. There are approximately 40,000 distillation columns in the US and they use approximately 6% of all the energy used in the US. This is a staggering amount of energy and roughly equivalent to 1.2 million barrels of oil per day. In Tutorial III the student was introduced to feed and tangent pinch points and the McCabe-Thiele method, a graphical procedure for both finding minimum energy requirements for binary distillations and designing practical columns. In Tutorial IV the student learned the concepts of distillation lines, pinch points, and the shortest stripping line distance approach. In each of these tutorials, minimum energy requirements that correspond to pinch points were presented and pinched designs were shown to always involve an infinite number of stages. Thus, general rules of thumb, which are needed for practical designs that can be built, are used to strike a balance between minimum energy requirements and the number of stages. These rules of thumb typically multiply the minimum boil-up or reflux ratio by a factor between 1.1 and 1.5, thereby increasing the amount of energy used in performing a desired separation. However, the number of stages often drops from infinity to somewhere between 20 and 200. Columns with as many as 200 stages do exist in the petroleum industry. A C3 splitter is a good example of a large column.
In this tutorial, the student will be introduced to the concept of non-pinched, minimum energy designs and the use of the shortest stripping line distance approach to find these non-pinched, minimum energy distillation designs. Binary columns do not have non-pinched, minimum energy designs and thus this tutorial is specifically concerned with mixtures of three or more components. Moreover, the importance of these non-pinched, minimum energy designs is that they contain a finite number of stages and therefore are potentially able to be constructed without using the general rules of thumb typically associated with pinched designs. Thus there can be an implicit energy savings of 10 to 50%!
Exercise. Explain why any minimum energy design for a binary distillation must be pinched.
1. Illustrations of Non-Pinched, Minimum Energy Distillation Design. Figure 6.1 gives an illustration of a non-pinched, minimum energy design for the mixture formic acid, acetic acid, and water at atmospheric pressure.
As shown in the figure, this mixture has simple distillation boundaries (shown in blue) that run from the acetic acid vertex through the ternary azeotrope and then to the formic acid vertex, the binary formic acid-water azeotrope, and the formic acid vertex. Thus there are four distillation regions.
Just press play.
Consider the two sets of column specifications shown in Table 1 and let the region to the upper left of Fig. 6.1 be Distillation Region I. The region to the lower right of Fig. 6.1 will be called Distillation Region II.
| Component | Feed+ | Distillate | Bottoms | Feed+ | Distillate | Bottoms | ||
| Formic Acid | 0.05377 | 0.0005 | 0.0717 | 0.700 | 0.9900 | 0.505 | ||
| Acetic Acid | 0.6600 | 0.0005 | 0.88 | 0.1216 | 0.005 | 0.20 | ||
| Water | 0.28623 | 0.999 | 0.0483 | 0.1784 | 0.005 | 0.295 | ||
| + Feed is saturated liquid (q=1) | ||||||||
For Distillation region I, with the bottoms specified very near the distillation boundary and a distillate product of high purity water, there is a minimum energy design shown by the black filled squares that is pinched. Here there are 300 stripping stages, 5 rectifying stages, and the boil-up ratio is smin = 6.6157. The stripping line distance of 0.7082 indicates the pinch point. However, there is also a non-pinched, minimum energy distillation design for the same separation, which is shown by the green filled squares and the stripping line distance of 0.3821. This non-pinched, minimum energy design has 72 stripping stages, 8 rectifying stages and a minimum boil-up ratio of smin = 6.6157.
The important points to understand here are that
- The boil-up ratio is the same for the pinched and non-pinched, minimum energy designs and clearly shows that increasing the number of stages does not result in a reduction in boil-up ratio.
- The non-pinched column design only has a total of 80 stages (not an infinite number) and is easily something that can be constructed!
- The non-pinched, minimum energy distillation design can operate at or very, very near minimum boil-up ratio. There is no need to increase the boil-up ratio by the usual design factor of 1.1 to 1.5 and thus there is an implicit energy savings over the pinched design.
- Without knowledge and the ability to find non-pinched, minimum designs, the practitioner might very well design a column for this separation that simply wastes energy!
Now consider Fig. 6.2 and the designs shown in Distillation Region II.
Just press play.
Here we choose a distillate product rich in formic acid and a bottoms product in the vicinity of the boundary. Again we can find both pinched and non-pinched, minimum energy designs for this desired separation. The pinched, minimum energy distillation design is shown by the black filled squares, has 300 stripping stages, a minimum boil-up ratio of smin = 3.75544, and a stripping line distance of 0.4026. The non-pinched, minimum energy distillation design, on the other hand, has 72 stripping stages, 5 rectifying trays, a minimum boil-up ratio of smin = 3.75544, and a stripping line distance of 0.3544.
Here again, the important points are that
- The boil-up ratio is the same for the pinched and non-pinched, minimum energy designs. Thus increasing the number of stages does not allow you to reduce the boil-up ratio.
- The column design only has a total of 77 stages and is easily something that can be constructed!
- The non-pinched, minimum energy distillation design can operate at or very near minimum boil-up ratio. There is no need to increase the boil-up ratio by the usual design factor of 1.1 to 1.5 and thus there is an implicit energy savings over the pinched design of 10 to 50%.
- Without this knowledge, a practicing design engineer would design a column that wasted energy.
Practice Exercises. Do the following.
- Reproduce the numerical results given in the illustrative example for formic acid, acetic acid, and water at 1 atm. To do this, you will need to use the UNIQUAC equation to model liquid activity coefficients and assume that the vapor phase is ideal.
- Find both pinched and non-pinched, minimum energy distillation
column designs for
the mixture chloroform, acetone and water at 1 atm using the
specifications shown in Table 2.
Table 2: Specifications for Chloroform/Acetone/Water Distillation from Koehler et al. (1995) Component Distillate+ Feed* Bottoms Chloroform 0.9450 0.4395 0.3297 Acetone 0.0330 0.0330 0.0330 Benzene 0.0210 0.5275 0.6373 + Feasible if xD(C) ≥ 0.945 *Saturated liquid (q = 1)
2. Determining Non-Pinched, Minimum Energy Designs. Unfortunately, until recently it was not possible to systematically find non-pinched, minimum energy distillation designs. This is because most methods for finding distillation designs like Underwood's method, boundary value methods, the rectifying body method, and so on are based on finding pinch points. However, finding non-pinched, minimum energy distillation designs is fairly straightforward if one uses the shortest stripping line distance approach. Thus the shortest stripping line distance approach represents the only methodology that is capable of systematically and intelligently finding non-pinched, minimum energy distillation designs.
There two situations that occur in finding non-pinched, minimum energy designs
- Non-pinched designs that can be obtained from feasible (or valid) pinched designs.
- Non-pinched designs that arise even when there are no feasible, pinched, minimum energy designs.
We discuss each separately.
2.1 Non-Pinched, Minimum Energy Designs Derived From Pinched, Minimum Energy Designs. This is the simplest situation of the two cases to understand because it involves a direct application of the shortest stripping line distance approach with an added feature that reduces the number of stages at fixed minimum boil-up ratio. By this I mean that non-pinched, minimum energy designs can be found by the following two-step procedure
- First find a minimum energy design that is pinched. Let's say that the minimum boil-up is smin.
- Keeping smin fixed, reduce the number of stages systematically to see if the design with fewer stages (and therefore a shorter stripping line distance) still makes the desired separation.
We now illustrate this in detail using the pinched and non-pinched, minimum energy designs for the formic acid-acetic acid-water separations. Consider the distillation design shown Distillation Region I.
Step 1: Using the shortest stripping line distance approach presented in detail in Tutorial IV and the column specifications shown in Table 1, we begin by finding a pinched, minimum energy design that makes the desired separation. Thus we might start with a high boil-up ratio, say s = 10, and find the feasible design corresponding to the first line of numerical data given in Table 3. Next we might try reducing the boil-up ratio to s = 8 and see if we can still find a feasible design. We can and these results are given in the second line in Table 3. Continuing in this fashion, we find that the smallest value of boil-up ratio that makes the desired separation gives the pinched, minimum energy design shown as the fourth line in Table 3, where smin = 6.6157 and the corresponding minimum stripping line distance is Ds = 0.708233.
Step 2: Next we fix the boil-up ratio at its minimum value calculated in step 1 and try to systematically reduce the number of stages, keeping in mind that we must still make the desired separation. Thus keeping the boil-up ratio fixed at smin = 6.6157, we find that the number of stripping stages can be reduced to Ns = 72, the required number of rectifying stages is Nr = 8, and the corresponding minimum stripping line distance is reduced to Ds = 0.382132.
| Boil-up Ratio | Ns* | Nr | Distance (Ds) | xNs+ | yD(calc) = (yFA, yAA) |
| 10.0 | 300 | 5 | 0.782629 | (0.00892, 0.18625) | (2.671x10⁻⁵, 1.885x10⁻²) |
| 8.0 | 300 | 5 | 0.744016 | (0.01079, 0.22225) | (3.007x10⁻⁵, 2.431x10⁻²) |
| 6.6157 | 300 | 5 | 0.708233 | (0.01264, 0.2557) | (3.372x10⁻⁵, 3.029x10⁻²) |
| 6.6157 | 90 | 5 | 0.708183 | (0.01269, 0.25742) | (3.372x10⁻⁵, 3.029x10⁻²) |
| 6.6157 | 80 | 5 | 0.698100 | (0.01273, 0.26750) | (3.323x10⁻⁵, 3.176x10⁻²) |
| 6.6157 | 75 | 6 | 0.583828 | (0.01622, 0.38171) | (6.656x10⁻⁶, 3.201x10⁻²) |
| 6.6157 | 72 | 8 | 0.382132 | (0.0047877, 0.580483) | (1.730x10⁻⁶, 2.982x10⁻²) |
| * Ns is the number of stripping stages | |||||
| + xNs is the liquid composition on stage Ns | |||||
We note that finding smin and then finding the smallest value of Ns that minimizes the stripping line distance can be automated using what is called mixed integer nonlinear programming (MINLP).
Practice Exercise. Systematically reproduce the numerical results in Table 3.
2.2 Standalone Non-Pinched, Minimum Energy Designs. There are also non-pinched, minimum energy designs that do not have a counterpart design that is pinched. Thus these designs are a bit harder to find.
Consider the separation of n-butane, iso-pentane, n-pentane, and n-hexane at 2.7572 x 10⁶ Pa (400 psia = 27.229 bar) defined in Table 4.
| Component | Distillate | Feed* | Bottoms | |
| n-butane | 0.42742 | 0.25 | 9.1x10⁻²¹ | |
| i-pentane | 0.50419 | 0.30 | 0.01228 | |
| n-pentane | 0.06839 | 0.20 | 0.38544 | |
| n-hexane | 10-10 | 0.25 | 0.60227 | |
| + Feasible if ||yD – yD (calc)|| ≥ 0.06 | ||||
| * Saturated liquid (q=1) | ||||
Figure 6.3 shows the non-pinched, minimum energy design in which the stripping and rectifying profiles exhibit a natural looping structure. This looping structure is a natural consequence of the fact that the components are removed (or stripped) one at a time as you move upward from the bottom of the column. By this I mean, if you follow the stripping line from the bottoms product to the stripping pinch point curve, you will see that first the three lightest components are stripped from the bottoms leaving n-hexane. As you go up the column, then iso-pentane and n-butane are removed, leaving n-pentane, then n-butane is removed, leaving iso-butane. Finally, you arrive near the n-butane corner. Similar behavior occurs in the rectifying section of the column.
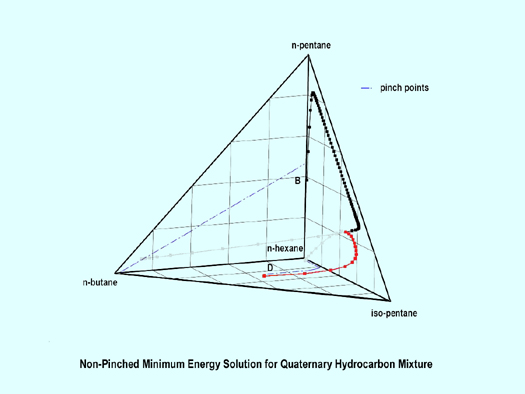 |
Figure 6.3
Because this type of non-pinched, minimum energy design does not come from a pinched, minimum energy design, it is a bit more difficult to determine.
List of Steps to Follow in Determining Standalone Non-Pinched, Min Energy Designs
- Starting from the desired bottoms composition, generate a stripping pinch point curve.
- Calculate the corresponding reflux ratio and generate a rectifying pinch point curve using the desired distillate composition.
- Pick a high value of boil-up ratio and generate a trajectory that runs from the bottoms composition to the stripping pinch point curve.
- Systematically reduce the number of stripping stages (from the stripping pinch point) and adjust the number of rectifying trays until a feasible design is located. This provides an initial stripping line distance to begin reducing energy demands.
- Alternate between reducing the boil-up ratio and adjusting the number of stripping (and rectifying) trays by minimizing stripping line distance. Here it is important to maintain feasibility.
- Stop when you can no longer reduce the stripping line distance.
Note that the above algorithm is, in fact, the minimum stripping line distance approach since it alternates between choosing boil-up ratio and stripping stages to minimize stripping line distance.
Illustration. We illustrate the determination of a
non-pinched,
minimum energy design for the student using the example shown in Fig.
6.3. In this example, the phase equilibrium model is the K-Wilson
method, where the liquid and vapor are modeled using a correlation given
by Wilson (1968). This correlation estimates K-values based on critical
properties and is given by the relationship
| Component | Tc(K) | pc (MPa) | ω |
| n-butane | 425.2 | 3.797 | 0.193 |
| i-pentane | 460.4 | 3.381 | 0.228 |
| n-pentane | 469.7 | 3.369 | 0.249 |
| n-hexane | 507.4 | 3.012 | 0.305 |
Set the pressure equal to 27.229 bar exactly; this problem is very
sensitive to pressure.
- Generate a stripping pinch point curve by choosing a large value of
boil-up ratio, s, and
finding the composition xj. This requires that you be able
to solve a
set of nonlinear algebraic equations of the form
[s/(s+1)]Kxj − xj − [1/(s+1)]xB (6.1)
where K is a vector of equilibrium ratios relating xj and yj. Repeating this exercise of picking s and finding x for many s in the range [0, ∞] will generate a stripping pinch point curve. This more general algebraic procedure described by Eq. 6.1 can have multiple solutions, which requires you to have a rather sophisticated equation solver. - Perform the same procedure using different values of the reflux
ratio, r, in the range [0, ∞] and the equation
[(r+1)/r]Kxj − xj − (1/r)xD = 0 (6.2) - We chose an initial value of s near 12 − s = 12.029. Note that while the stripping line pinches at a composition of x = (0.8898, 0.0019, 0.0512, 0.0571), it passes closer to the rectifying pinch point curve than it does the stripping pinch point curve on its way to the pinch point. This suggests that the behavior of this design might be more like a rectifying pinched design and have a finite number of stripping trays. Moreover, if you calculate minimum distances between points on the stripping trajectory and points on the rectifying pinch point curve you will notice that these minimum distances are smallest in the vicinity of 60 to 65 stripping stages. This gives a good estimate of the number of stripping stages to try. We choose the number of stripping stages to be 65. Next, we simply add rectifying stages until we get a feasible design. By trial and error, we discover that 4 rectifying stages will give a feasible design.
- Next we lower the boil-up ratio to s = 11 and find that there is a feasible column design with 65 stripping stages and 5 rectifying stages.
- We continue by reducing the boil-up ratio to s = 10.023 and find that a feasible column has 65 stripping stages and 8 rectifying stages. If we further reduce the boil-up ratio to 9 we cannot find a feasible design, regardless of the number of stripping and rectifying stages in the column. This tells us that the minimum boil-up ratio is between 9 and 10.023.
- Using a more sophisticated optimization procedure, we find the minimum boil-up ratio is smin = 9.9254 and the resulting feasible column has 65 stripping stages and 16 rectifying stages. Table 6 summarizes the results for this illustration.
Table 6: Numerical Results for Quaternary Hydrocarbon Distillation
Boil-up Ratio Ns Nr Ds+ DNP* yD(calc) = (yn−C4, yi−C5, yn−C5)& 12.029 65 4 2.46190 1.41707 (0.382885, 0.506150, 0.108468) 11.0 65 5 2.39763 1.36350 (0.412569, 0.477103, 0.109056) 10.023 65 8 2.32611 1.30441 0.381667, 0.511882, 0.106284) 9.9254 65 16 2.31784 1.29799 (0.425104, 0.543417, 0.031479) + Stripping line distance, Ds, is measured from xB to stripping pinch point curve * Stripping line distance, DNP, measured from xB to stage Ns & Feasible if ||yD − yD (calc)|| < 0.06
Practice Exercises. It is instructive to work
through
the following exercises:
- Show that the four component hydrocarbon distillation defined in
Table 4 does not admit a pinched, minimum energy design. To do this
consider these questions:
- Are there any stripping or rectifying pinch points that lie between the bottoms and distillate products?
- Can you find a stripping stage composition for any boil-up ratio that lies very near the rectifying pinch point curve?
- Look for a feasible column design for the four component hydrocarbon separator for a boil-up ratio between 15 and 30. How many stripping and rectifying stages does this column have?
- Look for a feasible column design for boil-up ratios between 5 and 9. Can you find any feasible designs?
- For all column designs, feasible or infeasible, notice that the stripping and rectifying profiles have a looping structure. This looping structure of the profiles is very typical of hydrocarbon separations in which the products are not near a vertex. In addition, for the design to be feasible these loops must intersect! Generate stripping and rectifying loops for s = 7.29344, which is the value predicted by Underwood's method. What happens? Does s = 7.29344 give a feasible design?
3. Reasons for the Existence of Non-Pinched Minimum Energy
Distillation Designs.
It is now useful to discuss for the student the reasons that underlie
the existence of non-pinched, minimum energy designs − of which
there
are several. However, understanding the reasons for the
existence of
non-pinched, minimum energy distillation designs is hard since there is
a lot going on. Nevertheless, in all cases, the common thread seems to
be
the complicated interplay between the distillation line profiles and the
pinch point curves.
The reasons for non-pinched, minimum energy distillation designs can be
divided into the following three main categories.
- From the formic acid, acetic acid, water examples, we have seen
that non-pinched, minimum energy designs occur when the separation under
consideration contains
- A maximum boiling azeotrope.
- A stripping pinch point curve with unstable branches.
- A product composition that lies near a distillation boundary.
- From the quaternary hydrocarbon distillation example, we have seen that non-pinched, minimum energy designs result from stripping and rectifying trajectories that exhibit natural looping and intersect on their way to their respective pinch point curves and the trajectory in at least one section of the column shows reverse separation of one of the key components.
- In Tutorial VII we will show the student that non-pinched, minimum energy designs are common in multi-unit processes such as reactive distillation and extraction-distillation because certain ancillary constraints must be satisfied.
1) Mixtures that can form azeotropes often have pinch point curves that exhibit bifurcations and split into stable and unstable parts. Non-pinched designs for columns separating azeotropic mixtures exist whenever part of the liquid composition profile follows an unstable branch of a pinch point curve so that tray compositions correspond to unstable pinch point compositions. In addition, the boil-up ratio for the actual column must be greater than the boil-up ratio for any given unstable pinch point.
For example, the pinched design solutions for the formic acid/acetic acid/water separation for column 1 with smin = 6.6157 (with corresponding rmin = 18.818739) and for column 2 with smin = 3.75544 (with corresponding rmin = 4.583277) each follow a portion of the unstable branch of the stripping pinch point curve in the appropriate distillation region. See the solid curves shown in Figs. 1 and 2. Thus liquid compositions on the upper stages in the stripping section of these pinched designs actually have values that are unstable pinch point compositions. Moreover, these stage compositions in these non-pinched designs occur at higher values of boil-up (and reflux) ratio. That is, the non-pinched design for column 1 shown in Table 4 with smin = 6.6157 has a liquid composition on stage 72, x72 = (0.0479, 0.5805), that is equal to the unstable pinch point composition that corresponds to a lower boil-up ratio of s = 2.70209. Similarly for column 2, liquid composition x72= (0.7736, 0.06365) in the non-pinched design with smin = 3.75544 actually corresponds to an unstable pinch point composition for s = 2.38409. Consequently these stage compositions, x72 in column 1 and x72 in column 2, which correspond to unstable pinch points at higher values of reboil ratio (and reflux ratio) make it possible to reduce the number of stripping stages, which in turn results in non-pinched, minimum energy designs for these separations. Actually there are many non-pinched designs for these separations since all compositions x72 to x299 in columns 1 and 2 correspond to unstable pinch points at higher boil-up ratio.
2) There are many situations that we have encountered, like the quaternary hydrocarbon separation, where the stripping and/or rectifying line trajectory passes near each other well away from any pinch point curves. For the illustrative hydrocarbon example that we provided for this situation, rectifying lines (including the one for minimum reflux ratio) loop around and pass very near stripping lines before converging to their respective pinch points. Telltale signs of this looping structure include key component compositions that go through maxima − as can be seen in Fig. 6.3. It is this looping structure of the rectifying and stripping line trajectories that give rise to non-pinched designs and one in particular that uses minimum energy!
Summary Exercises Consider the chloroform,
acetone, benzene mixture and the separation defined in Table 2, where
you can assume that the liquid phase is modeled by the UNIQUAC equation
and the vapor phase is ideal. Perform the following analysis:
- Generate the simple distillation boundaries for this mixture.
- Generate the stripping and rectifying pinch point curves.
- Identify the stable and unstable branches of the pinch point curves from 2.
- Find the pinched, minimum energy design for this separation.
- Show that the part of the liquid composition profile for the pinched design follows an unstable branch of the pinch point curve.
- Find the non-pinched, minimum energy design for this separation.