Distillation Tutorial I: Basic Concepts (Main Page)
In this session the student will get an overview of distillation, learn basics concepts of vapor-liquid equilibrium, and be introduced to elementary mass balance concepts.
1. An Overview of Distillation. Distillation is a very versatile process that is used throughout a wide variety of industries to separate mixtures of different chemical species. Distillation is used in:
- Oil and gas production, which requires the separation of oil, gas, and water.
- The petroleum industry to separate different fuels and chemical feed stocks.
- The chemical and pharmaceutical industries to separate products from by-products and raw materials and to recover solvents.
Distillation accomplishes separation by exploiting boiling point differences between different chemical species. For example, at atmospheric pressure acetone (nail polish remover) boils at 56.02°C while water boils at 100°C. This simply means that the vapor pressure of acetone is higher than the vapor pressure of water at temperatures between 56.02 and 100°C (actually at all temperatures).
Suppose we consider a 50-50 mol % mixture of acetone and water at atmospheric pressure. Then there will be a range of temperatures (between 60.23 and 82.15°C) at which both vapor and liquid mixtures of acetone and water exist. The lower temperature, 60.23°C, is called the bubble point temperature (since it is the temperature at which the first bubble of vapor appears on heating). The upper temperature, 80.15°C, is called the dew point temperature because it is the temperature at which the first drop of liquid appears on cooling.
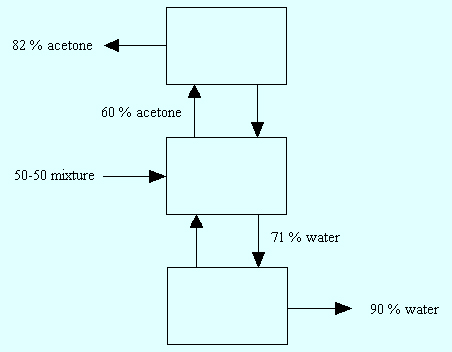
Now suppose we were to measure the composition of the vapor and liquid at any temperature between 60.23 and 82.15°C. Then the vapor phase would have more than 50 mol % acetone and the liquid would have less than 50 mol % acetone. Thus by simply bringing a mixture of acetone and water to a temperature in the range of 60.23 and 82.15°C, we are able to place more acetone in the vapor and more water in the liquid. In other words, we can effectively separate the original 50-50 mixture of acetone and water to some degree. By condensing the acetone-rich vapor and repeating this process, we can again make the vapor even richer in acetone. Eventually if we repeat this process of condensing and re-boiling then we can reach the point where the vapor is very, very rich (almost pure) acetone. In much the same way, we can make the liquid have higher and higher amounts of water. The figure shown below gives you a schematic of what we just described.
|
Energy Costs. Unfortunately, to accomplish separation we must use energy. While distillation is one of the most versatile separation processes, it is also one of the most costly from an energy perspective. Studies have shown that there are some 40,000 distillation columns in the U.S. and that these distillation processes account for approximately 18% of the energy used in the manufacturing sector. The actual amount of energy use is around 2.5 quadrillion British thermal units (Btu) per year. That's 2.5 x 10¹² Btu/yr. – a staggering amount of energy! Thus it is important to consider energy consumption when designing distillation processes in order to make efficient use of our energy resources.
Some Elementary Technical Concepts. The design and/or operation of a distillation column is subject to certain physical principles
- Mass balancing or the conservation of mass.
- Vapor-liquid equilibrium.
- Energy balancing or the conservation of energy.
The conservation of mass and energy are considered to be fundamental or first principles and are actually very easy to understand. Basically what they say is the following
| Mass in – Mass out = the amount of mass gained or lost | (1.1) | |
| Energy in – Energy out = the amount of energy gained or lost | (1.2) |
I find that at an introductory level it is often helpful for students to think of these concepts in terms of money.
| Money earned – Money spent = the amount of money leftover | (1.3) |
For example, if money earned = $500 and money spent = $300, then you have + $200 left to either save or spend on something else. Thus the right hand side of the above equation would be +200. On the other hand, if the initial amount of money spent was $600 instead of $200, then you would be in debt for $100 or the right hand side of the above equation would be -100. These same concepts apply to mass and to energy! Later on we will show you how to do this type of accounting with mass and energy, which is called mass and energy balancing.
Understanding vapor-liquid equilibrium is a little harder than understanding conservation laws – but it's not too hard. Because vapor pressure and other physical properties are different for different chemical species, the degree to which mixtures can be separated by distillation is dependent on the chemical species involved and the composition of the mixture. Returning to the earlier acetone and water example, we see that acetone boils at 56.02 and water at 100°C; thus the boiling point difference is roughly 40°C. This large difference in boiling point means that acetone and water are relatively easy to separate by distillation and will not require a lot of distillation stages or an excessive amount of energy. If, on the other hand, we tried to separate a mixture of ethane and ethylene or a mixture of propane and propylene, we would find these distillations to be very difficult. They would require a large number of distillation stages (a tall column nearly 300 ft with a diameter of 12 or more ft) and would use lots of energy. This is because the boiling point differences between ethane and ethylene or propane and propylene are very small.
A useful rule of thumb for determining the difficulty of a given distillation is the following: if two chemical species have a large boiling point difference, then they are easy to separate by distillation. On the other hand, if two compounds have a narrow boiling point difference, then they are more difficult to separate by distillation.
Units. Before moving on to more of the details of vapor-liquid equilibrium, mass balancing and distillation, we mention the need to pay careful attention to units. The reason for this is because any equation such as the mass balance or energy balance presented earlier involves quantities that have units. For example, the units in Eq. 1 could be kg/hr or lbmol/min while those in the energy balance could be Btu/lb, Btu/hr, or kJ/s.
It is important to make sure that the units of each term in any equation are the same. Just like you can't add $ and Yen (without making a conversion), you can't add Btu/h and kJ/s without making the proper conversion.
Always pay careful attention to units and make sure you make the appropriate conversions before adding quantities in a given equation.
Exercise Questions. A petroleum refinery usually involves a lot of distillations in order to separate a variety of fuels and oils.
- Find a process flow diagram of a typical petroleum refinery that begins with the separation of light gases (methane) and contains distillations such as a C2 splitter, C3 splitter, BTX separations, and so on. Go through each separation in this distillation train and identify which are 'easy' and 'difficult' separations and explain why.
- Consider the C2 splitter and do the following.
- Estimate the boiling point of both
components at the pressure of the distillation column. To do this,
you will need to find Antoine constants and use the Antoine
equation
lnPsat = A + B / (T + C)
and determine the temperature at which Psat = the pressure of the distillation column. Each component will give you a different temperature. Pay attention to units. - Calculate the vapor pressure of the two chemical species or components involved at a temperature midway between the two temperatures determined in part a. The component with the highest vapor pressure is called the light component and the one with the lowest vapor pressure is called the heavy component.
- Divide the vapor pressure of each component by the pressure at which the separation is conducted. This value is often called an equilibrium constant or K-value.
- Divide the largest K-value by the smallest. This ratio is called the relative volatility. What is the relative volatility for this C2 mixture?
- Estimate the boiling point of both
components at the pressure of the distillation column. To do this,
you will need to find Antoine constants and use the Antoine
equation
- Assuming 100% separation, if the C2 splitter is fed with 10000 lbmol/h of a 40-60 mixture of light to heavy component, how much light component comes out of the top of the distillation column and how much heavy component comes out of the bottom. What would be the result if we did not assume 100% separation?
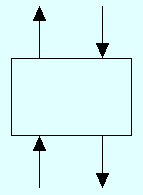
2. Conservation of Mass and the Concept of Mass Balancing. Consider the simple single-stage separation or flash process shown in Fig. 2 in which there are two entering or feed streams and two output or product streams.
| Vj | Lj+1 | |||
| yA,j | xA,j+1 |
 |
| Vj-1 | Lj | |||
| yA,j-1 | xA,j |
Total Mass Balance: To perform a total mass balance we simply add the streams going in and subtract the streams going out. This gives
| Vj-1 + Lj+1 – Vj – Lj = total mass accumulated or depleted from stage | (1.4) |
Quick question: What are the units of the quantities on the left of Eq. 2.1? What are the units of the quantity on the right?
Now if we say that the right hand side of this equation is zero, then we call this a steady-state total mass balance. Steady state means no accumulation or depletion with respect to time. Thus at steady state, Eq. 1.4 becomes
| Vj-1 + Lj+1 – Vj – Lj = 0 | (1.5) |
Component Mass Balance: We must also do proper accounting for individual species, which are called component mass balances. Again suppose we return to the acetone-water example described earlier. Then the amount of acetone that enters the stage shown in Fig. 2 must be equal to the amount of acetone leaving that stage if we assume steady-state behavior. Suppose the subscript A denotes acetone and y is the mole fraction of acetone in any vapor stream while x denotes the acetone mole fraction in any liquid stream. This does not mean that all of the streams denoted by y have the same mole fraction nor does it mean that all of the liquid stream x's are the same. Quite the contrary, for separation, they must be different. The variables x and y simply denote different stream mole fractions for the chemical species involved.
To do the accounting for acetone we can write the following acetone mass balance
| Vj-1yA,j-1 + Lj+1xA,j+1 – VjyA,j – LjxA,j = 0 | (1.6) |
Note that Eq. 1.6 is simply a mathematical equation that says the amount of acetone in is equal to the amount of acetone out at steady state. We can also do the same thing for water. If W denotes water, then the water mass balance would be very similar in form and is given by
| Vj-1yW,j-1 + Lj+1xW,j+1 – VjyW,j – LjxW,j = 0 | (1.7) |
Finally it is important to realize that if we add Eqs. 1.6 and 1.7, we get Eq. 1.5. The reason this is important is that it shows that these three equations are dependent on each other and cannot all be used at the same time to determine unknown things.
Quick Exercise. Add Eqs. 1.6 and 1.7 and show that the result is Eq. 1.5. Explain why this is so.
Constant Molar Overflow. Often times in distillation, we make the approximation that the vapor and liquid molar flows in the rectifying and stripping section of the column are constant. We call this concept Constant Molar Overflow and it is frequently abbreviated CMO. For the simple flash process shown in Fig. 2, the assumption of constant molar overflow means that
| Vj-1 = Vj = V | (1.8) |
| Lj+1 = Lj = L | (1.9) |
Therefore, using the CMO assumption, Eqs. 1.6 and 1.7 become
| VyA,j-1 + LxA,j+1 – VyA,j – LxA,j = 0 | (1.10) |
| VyW,j-1 + LxW,j+1 – VyW,j – LxW,j = 0 | (1.11) |
Exercise Questions. Mass balance equations are frequently used to determine unknown flow rates of streams in distillation and other processes.
- Use Eqs. 1.10 and 1.11 and the values xA,j+1 = 0.64, xA,j = 0.15, yA,j = 0.74 and yA,j-1 = 0.28 to calculate the values of V and L.
- Write the total mass balance for the single-stage flash process under the assumption of CMO. Is there anything strange about the result?
- Suppose the approximation of CMO did not hold for the single-stage flash process. Given the mole fractions in question 1, what equations would apply and how many unknown stream flow rates are there?
- Do you have enough equations to determine all of the unknown stream flow rates in question 3? If not, what can you do?
3. Vapor-Liquid Equilibrium. The determination of vapor-liquid and other forms of equilibrium are the subject of thermodynamics. Mathematical representations of vapor-liquid equilibrium range from very simple models like Raoult's law to very complicated models that are well beyond the scope of this tutorial. In general all mathematical models for vapor-liquid equilibrium can be written in the form
| Kixi = yi , i = 1, ..., c | (1.12) |
where x is the liquid mole fraction, y is the vapor mole fraction, K is called an equilibrium ratio or K value, i is simply an index used to distinguish different chemical compounds, and c is the total number of chemical species in the mixture. For example, in the acetone-water mixture studied in section 2, i = 1 could stand for acetone, i = 2 could denote water, and c would equal 2. Don't be intimidated by this, you'll get used to it. It's just shorthand notation to make writing things and communicating clearly and succinctly.
The difficulties in all of this come from the fact that Ki can be a very complicated function of temperature, pressure, liquid composition, and vapor composition.
Raoult's Law. This mathematical model for vapor-liquid equilibrium is based on the assumption that the K value for each component in the mixture depends only on temperature and pressure. Remember
| Ki = Pisat / p, i = 1,..., c | (1.13) |
where lnPisat = Ai + Bi/(T + Ci), T is temperature, p denotes the pressure of the system, and the constants Ai, Bi, and Ci are the Antoine constants for the ith chemical species. Simply put, in Raoult's law the K value of each chemical compound is just the ratio of that compound's vapor pressure to the pressure of the system. It is important to realize that Eq. 1.13 clearly shows that Ki is a function of only temperature and pressure. To be useful in determining vapor-liquid equilibrium Eq 1.13 must be applied over a temperature and/or pressure range for which at least one K value is greater than 1 and one K value is less than 1. This will be illustrated shortly.
It is also important to remember that equations like Raoult's law are only approximations of what is observed physically. Thus Raoult's law could be a good approximation for some mixtures and a poor approximation for others.
Exercise Questions. Remember that models are only models – sometimes good, sometimes not so good!
- Consider a binary mixture of ethane and ethylene. Find the Antoine constants for ethane and ethylene.
- Use these Antoine constants to determine the boiling points of ethane and ethylene at 300 psia.
- Use the Antoine constants from question 1 and calculate the K values for ethane and ethylene for 3 different temperatures between the boiling points of ethane and ethylene at a system pressure of 300 psia.
Bubble and Dew Point Temperatures. Compounds like ethane and ethylene boil and condense at a single temperature – their boiling point. Mixtures, on the other hand, boil and condense over a range of temperature that depends on the composition of the mixture and the chemical compounds that make up the mixture. For mixtures, the temperature at which boiling takes place is called the bubble point temperature and the temperature at which condensation occurs on cooling is called the dew point temperature. Determining the bubble or dew point temperature of a mixture is best done with the use of a computer. For example, to determine the bubble point temperature and corresponding vapor composition for a 50-50 mol % mixture of ethane and ethylene at 100 psia using Raoult's law we must follow the steps given below.
- Gather the Antoine constants for ethane and ethylene.
- Guess the bubble point temperature, T.
- Calculate the K value for ethane and ethylene.
- Calculate y1 and y2 using yi = Kixi where 1 = ethylene and 2 = ethane.
- Add y1and y2 (denoted Σyi) and compare this value with 1.
- If Σyi = 1, then T is the correct bubble
point temperature and y is the bubble point composition.
Otherwise, - Guess at a new bubble point temperature and repeat steps 3 through 6 until Σyi = 1.
Let's illustrate this bubble point calculation for a 50-50 mol % mixture of ethane and ethylene at 100 psia.
- I will let you gather the Antoine constants.
- Guess T = 240 K.
- K1 = 2.0758 and K2 = 1.2255.
- y1 =0.6127, y2 = 1.0379.
- If Σyi = 1.65067.
- Since is unequal to one, guess a new temperature.
- Guess new bubble point T = 224.265 K and repeat calculations.
The following table gives the results of a sequence of bubble point calculations that converge to the correct bubble point temperature of a 50-50 mol % mixture of ethane and ethylene that behaves according to Raoult's Law.
| T (K) | K1 | K2 | y1 | y2 | Σy1 | phases |
| 240.00 | 2.0758 | 1.2255 | 1.0379 | 0.6127 | 1.6506 | only V |
| 224.265 | 1.3796 | 0.7656 | 0.6898 | 0.3828 | 1.0726 | V-L |
| 222.00 | 1.2926 | 0.7105 | 0.6463 | 0.3552 | 1.0015 | V-L |
| 221.95 | 1.2907 | 0.7093 | 0.6465 | 0.3546 | 1.0000 | VLE |
In this table V = vapor, V-L = vapor-liquid, and VLE = vapor-liquid in equilibrium. Note that these calculations can require steps 3 through 6 to be performed many times and thus can be a bit tedious to do by hand. However, they can be done effectively using a computer. Also notice that when vapor-liquid equilibrium exists, the K value for at least one component is greater than 1 and the K value for at least one component is less than 1. Here ethylene has a K value of 1.2907 and ethane has a K value of 0.7093. Ethylene is called the light component and ethane is called the heavy component in this example.
Dew point temperature calculations reverse the roles of x and y in the previous illustration. By this I mean that in a dew point temperature calculation we try to determine the dew point temperature and corresponding liquid composition x given the vapor composition y and the system pressure.
Exercise Questions. Bubble and dew point temperature calculations are important because they make up part of the calculations embedded in distillation calculations.
- Find the bubble point of a 40-60 mol % mixture of ethylene and ethane at 300 psia.
- Find the dew point temperature and liquid composition for a 40-60 mol % mixture of ethylene and ethane at 300 psia.
Txy and yx Diagrams.Chemical engineers have a variety of ways of representing vapor-liquid equilibrium. One way of representing vapor-liquid equilibrium for a binary mixture is by constructing what is called a Txy (or Temperature-composition) diagram. To do this, we must calculate bubble point (or dew point) temperatures and compositions over the entire composition range [0, 1]. Usually we do this for some finite set of evenly spaced compositions – maybe 100 points – so we get nice smooth curves when we plot T vs. x and T vs. y. A Txy diagram is called a Txy diagram because we plot both T vs. x and T vs. y on the same coordinate system. Figure 3 shows a Txy diagram for ethane and ethylene at 100 psia. Remember, this is nothing more than a lot of bubble point temperature calculations.
Just press play.
Figure 3 shows the bubble point (T vs. y) and dew point (T vs. x) curves along with an illustration of how to interpret these curves. The x-axis represents the mole fraction of ethylene in the mixture. So x = 0.4 means 0.4 ethylene and 0.6 ethane (or 40 mol % ethylene and 60 mol % ethane). The ordinate (or y-axis) is the temperature in Kelvin. For a 50-50 mol % mixture of ethylene and ethane at 100 psia, we follow the red vertical line to the bubble point curve and then follow the horizontal red line to the bubble point temperature. Note that this gives the calculated value of 221.95 K. For the same 50-50 mixture the dew point temperature is determined by following the green horizontal line to the dew point curve and then the green horizontal line to the dew point temperature, which is 224.8 K.
The Lever Rule. Note as we said earlier, this mixture changes phase over a range of temperature. At the bubble point temperature the mixture is liquid (with one bubble of vapor). As the temperature is raised, it becomes a mixture of liquid and vapor until it reaches the dew point, at which it is vapor with one drop of liquid remaining. To determine the relative amounts of liquid to feed and vapor to feed at any temperature between the bubble and dew point temperature, we can use a graphical form of mass balancing called the Lever Rule, which is illustrated in Fig. 3. For the temperature of 224 K, the amount of vapor and liquid are simply determined by
| V/F = (length of chord AC)/(length of chord AB) | |
| L/F = (length of chord CB)/(length of chord AB) |
Quick Exercise. Determine L/F and V/F at 224 K by simply measuring the lengths of the different chords and using the formula.
Another way that chemical engineers represent vapor-liquid equilibrium is by using a yx diagram. Figure 4 shows a yx diagram for the mixture ethane-ethylene at 100 psia.
Just press play.
In Fig. 4, x and y refer to the mole fraction of ethylene (the lighter of the two components). A yx diagram is easy to interpret. For each value of liquid composition, x, one simply moves vertically to the equilibrium line and then horizontally to the y-axis to determine the vapor composition, y, in equilibrium with that liquid. The only drawback of a yx diagram (as compared to a Txy diagram) is that there is no temperature information on the yx diagram. However, a general rule of thumb is that as you move up and to the right, the equilibrium temperature decreases. In Fig. 4 we have also shown the 45-degree line and the reason for this will become more apparent in the next tutorial.
Summary Exercises. Please complete the following exercises to determine how well you have understood the material in Distillation Tutorial I.
- Consider a mixture of ethane and propane at 200 psia. Find the Antoine constants for ethane and propane and identify the light and heavy component.
- Find the bubble and dew point temperatures of a 50-50 mol % mixture of ethane and propane at 200 psia. Assume that Raoult's Law is an adequate model of equilibrium.
- Construct Txy and yx diagrams for ethane-propane at 200 psia.
- Repeat questions 1 through 3 for a mixture of acetic acid and water at atmospheric pressure.
- On your yx diagram, also plot the experimental data for acetic acid and water at 1 atm given below.
- What can you say about the differences between your yx diagram for acetic acid and water that assumes behavior according to Raoult's Law and the experimental data? Why do they not agree?